Ratio matters: change the way you see things!
How often do you fix the aspect ratio?
When creating scatterplots, how often do you fix the aspect ratio? #RStats #tidyverse #TidyTuesday #Python #ggplot2
— Thiyanga Talagala (@thiyangt) August 9, 2020
Aspect ratio
The aspect ratio of a plot is the ratio of its height-to-width . The aspect ratio we choose for our graph plays a significant role. The graphs below plot exactly the same data points but they have different aspect ratios.
library(tidyverse)
library(patchwork)
x <- 1:100
y <- x
df <- data.frame(x=x, y=y)
p1 <- ggplot(df, aes(x=x, y=y)) + geom_point() +  coord_fixed(ratio=2) + ggtitle("Aspect ratio = 2")
p2 <- ggplot(df, aes(x=x, y=y)) + geom_point() +  coord_fixed(ratio=0.5) + ggtitle("Aspect ratio = 0.5")
p3 <- ggplot(df, aes(x=x, y=y)) + geom_point() +  coord_fixed(ratio=1) + ggtitle("Aspect ratio = 1")
p1|p2|p3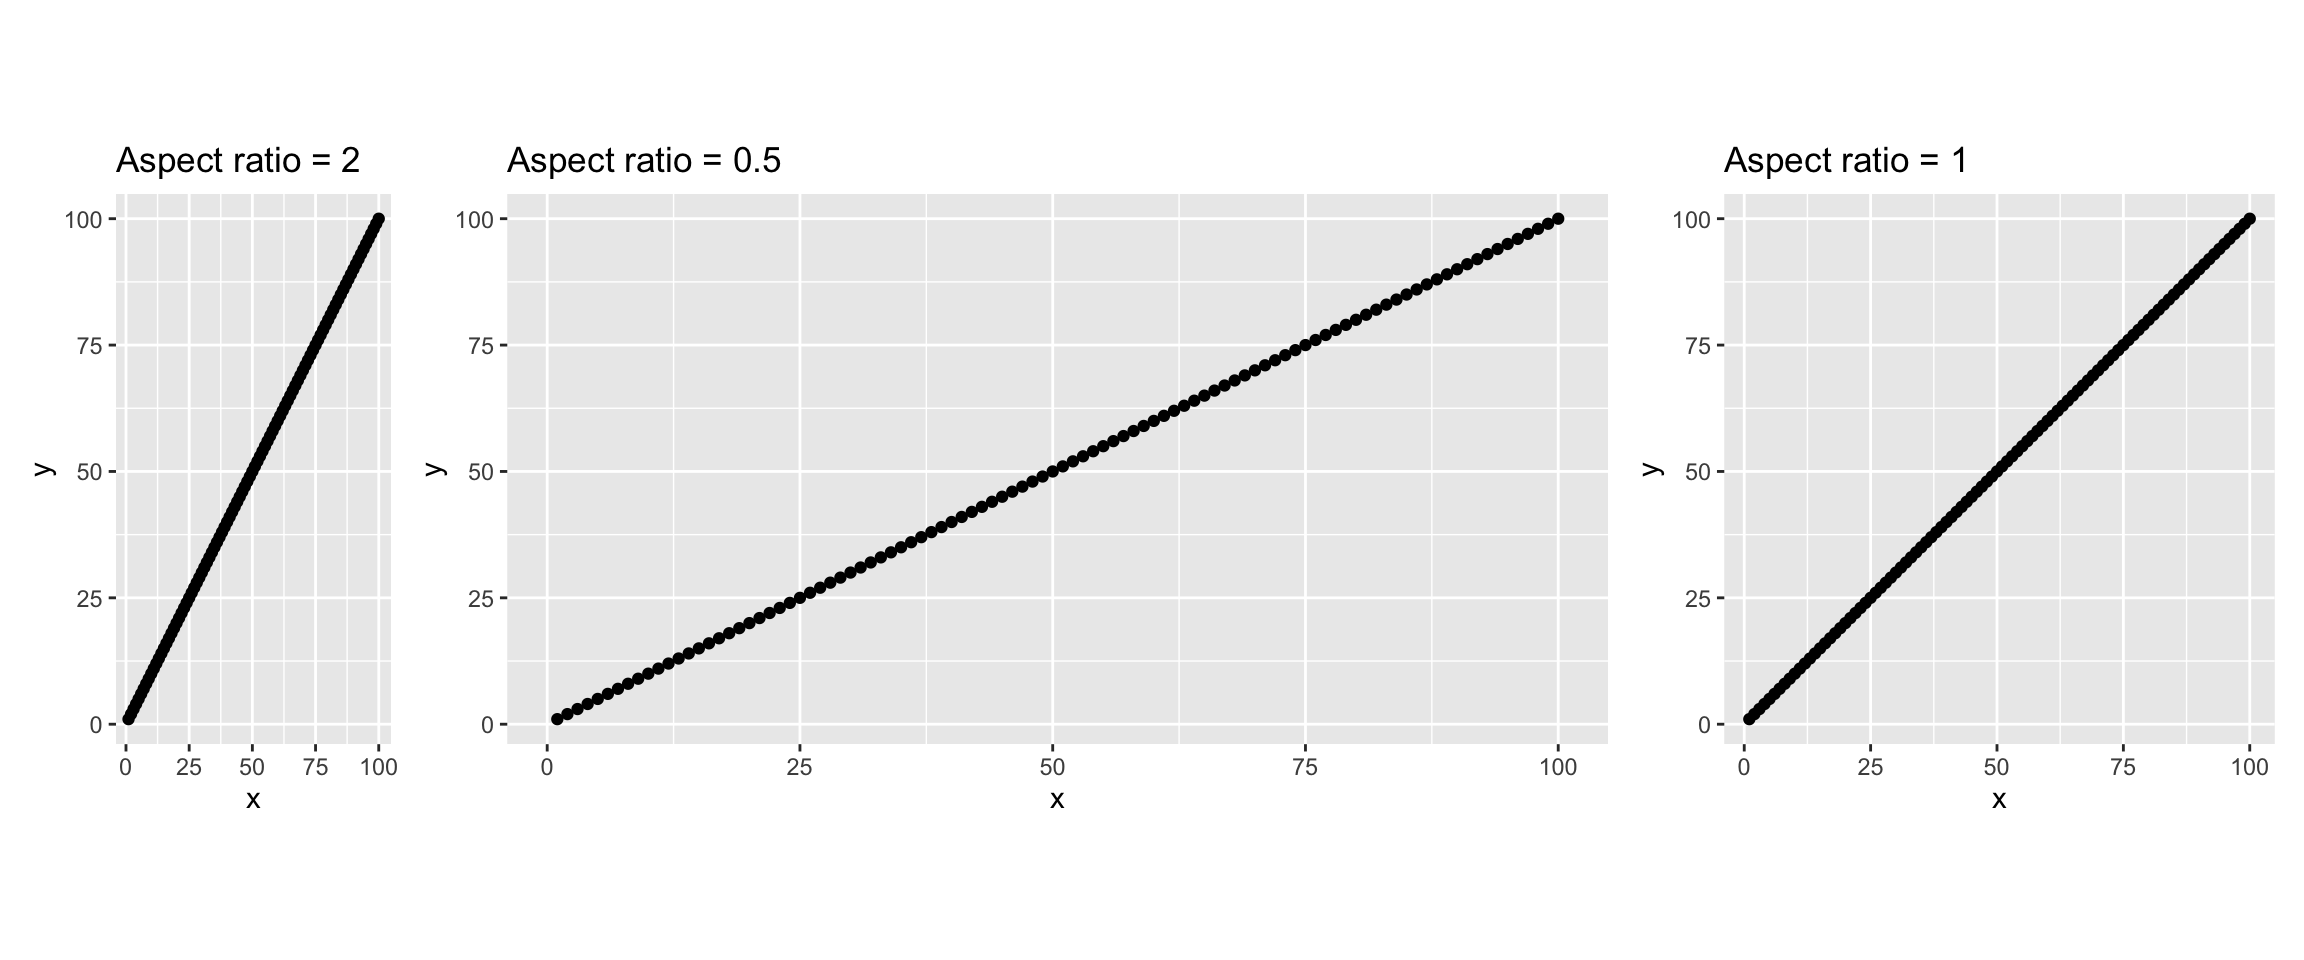
The aspect-ratio of a plot can make an influence on the reader’s mind.
Here is an example. I generate a set of random points inside a unit circle. The equation of the unit circle center at (0, 0) is: \(x^2+y^2=1\).
set.seed(2020)
x <- runif(10000, -1, 1)
y <- runif(10000, -1, 1)
fx <- x^2 + y^2
coly <-  ifelse(fx <= 1, 1, 0)
coly <- as.factor(coly)
circle.points <- data.frame(x=x, y=y, coly=coly)
head(circle.points)
x y coly
1 0.29380568 -0.7572887 1
2 -0.21154848 0.2479973 1
3 0.23700363 0.4911537 1
4 -0.04621773 0.3838934 1
5 -0.72780563 0.8263328 0
6 -0.86523123 -0.3060675 1Without fixing aspect ratio
ggplot(circle.points, aes(x=x, y=y, col=coly)) +
   geom_point() +
   scale_colour_manual(values = c("#e7298a", "#1b9e77")) +
theme(legend.position = "none") 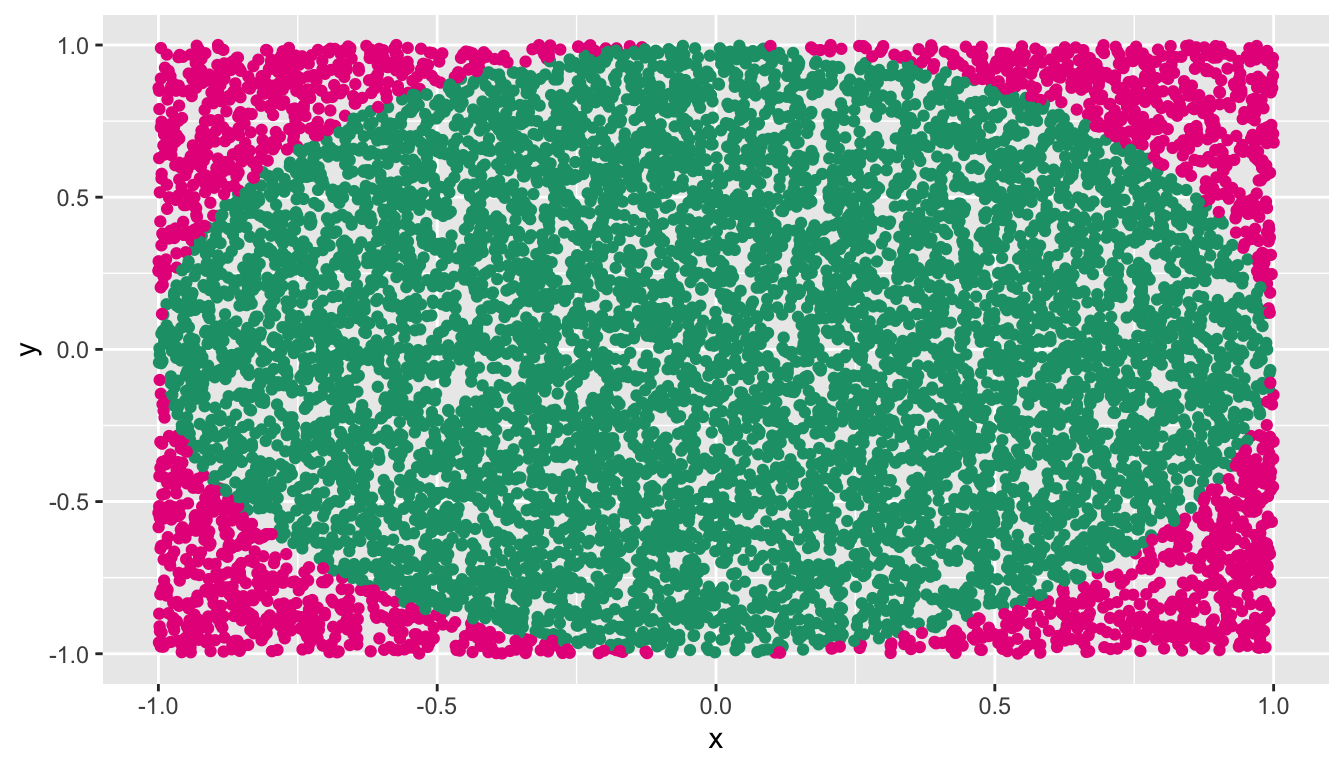
According to the plot above it seems that the region is bounded by a ellipse. However, our points are not generated from an elliptical region.
Aspect ratio is fixed
ggplot(circle.points, aes(x=x, y=y, col=coly)) + geom_point() +
   scale_colour_manual(values = c("#e7298a", "#1b9e77")) +
  coord_equal() +
  ggtitle("Figure 2: Aspect ratio is fixed.") +
theme(legend.position = "none") 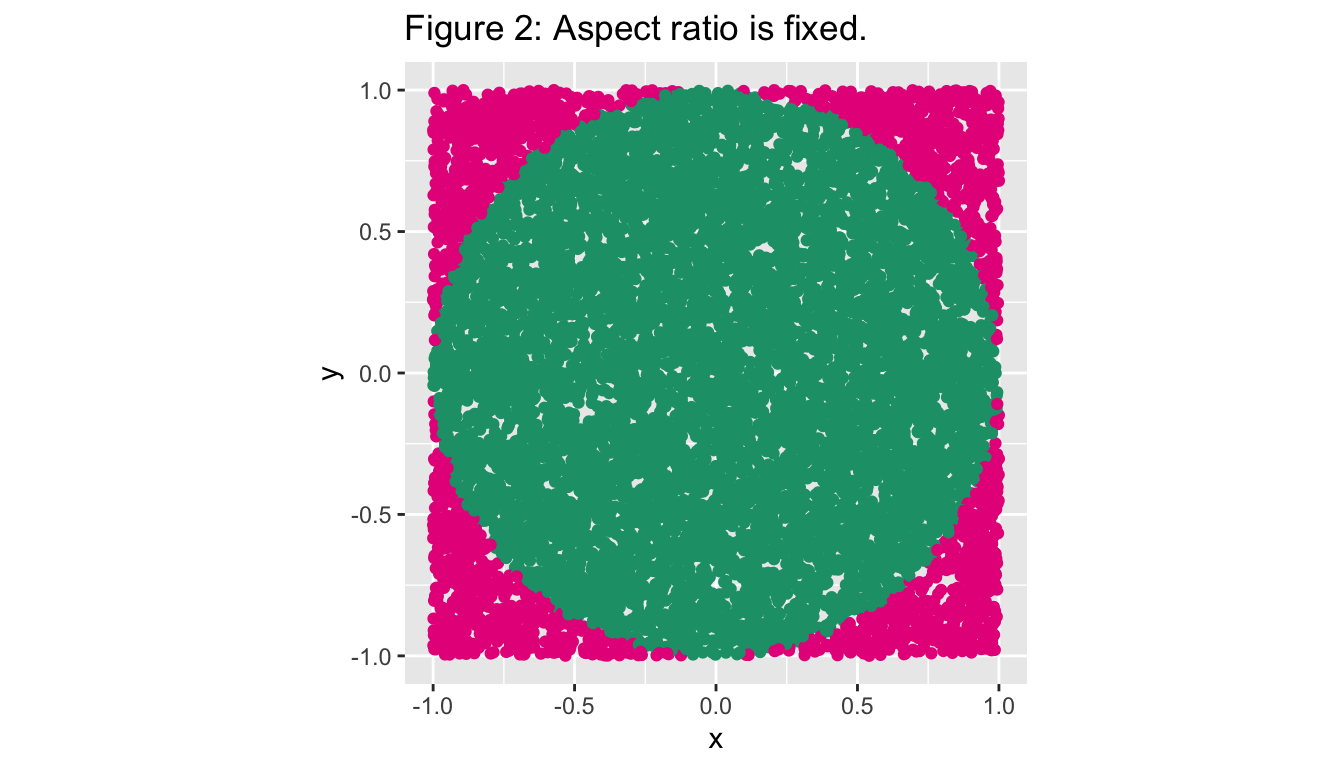
When you create the plot by preserving the aspect ratio the region is bounded by a circle.