Highlight data points in a scatterplot

Step 1: Load Libraries
library(tidyverse)Step 2: Dataset
set.seed(20201215)
df <- tibble::tibble(x=rnorm(100), y=rnorm(100))
Now we are going to work on our scatterplot.
Step 3: First draw a scatterplot with your full data
ggplot(df, aes(x=x, y=y)) +
  geom_point() +
  coord_equal()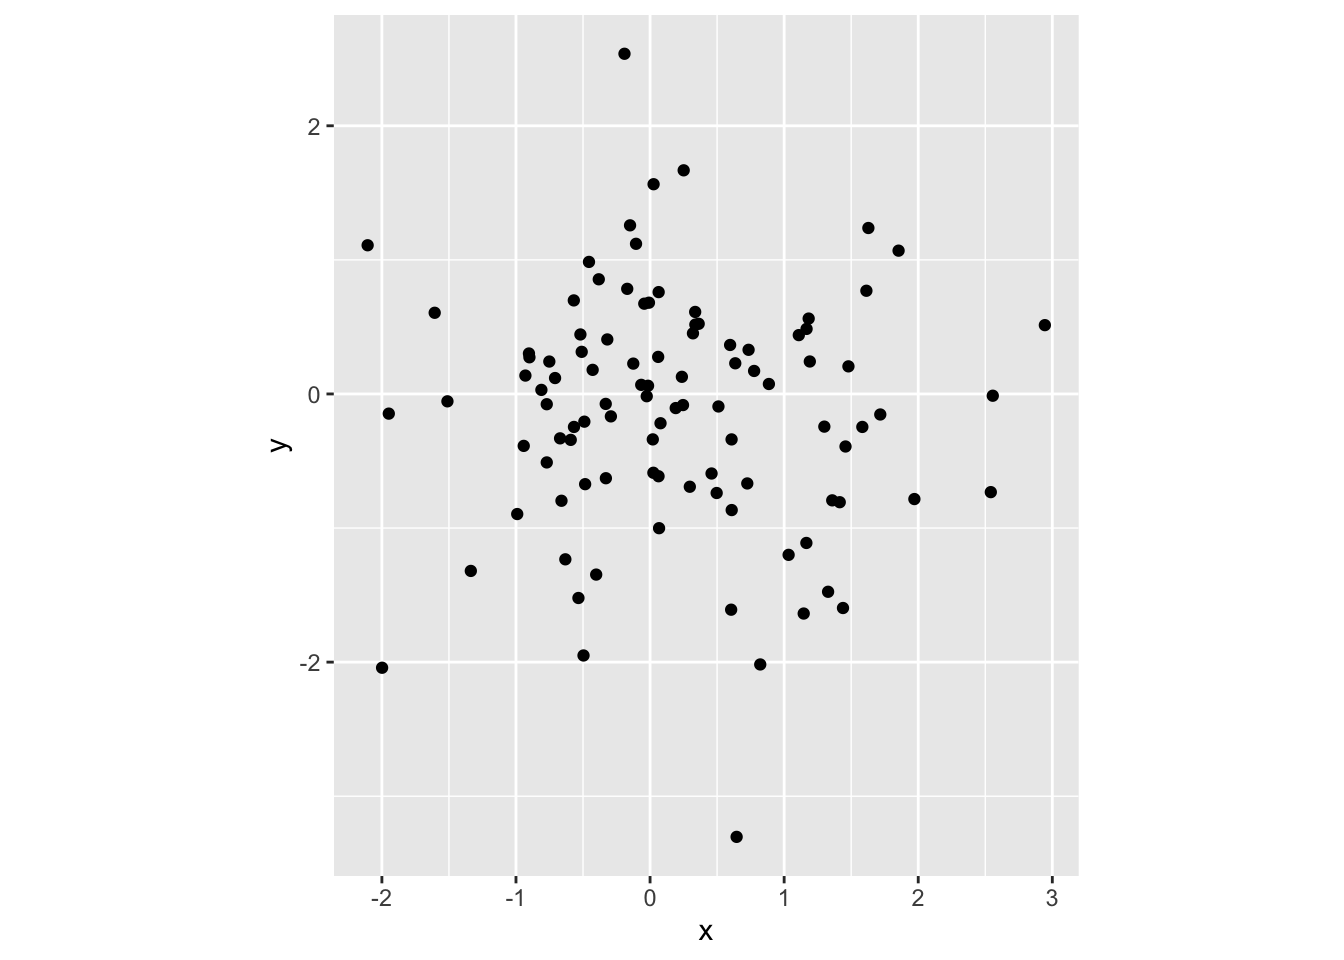
Step 4: Store the points that you need to highlight in a new data.frame or tibble.
Suppose I want to highlight 5th, 10th and 15th points.
df2 <- df[c(5, 10, 15), ]
df2
# A tibble: 3 × 2
x y
<dbl> <dbl>
1 0.646 -3.30
2 2.54 -0.732
3 -0.383 0.855Step 5: Now you need to inform above points to the ggplot through another geom_point layer.
ggplot(df, aes(x=x, y=y)) +
  geom_point() +
  coord_equal() +
  geom_point(data=df2, aes(x=x, y=y), colour="red")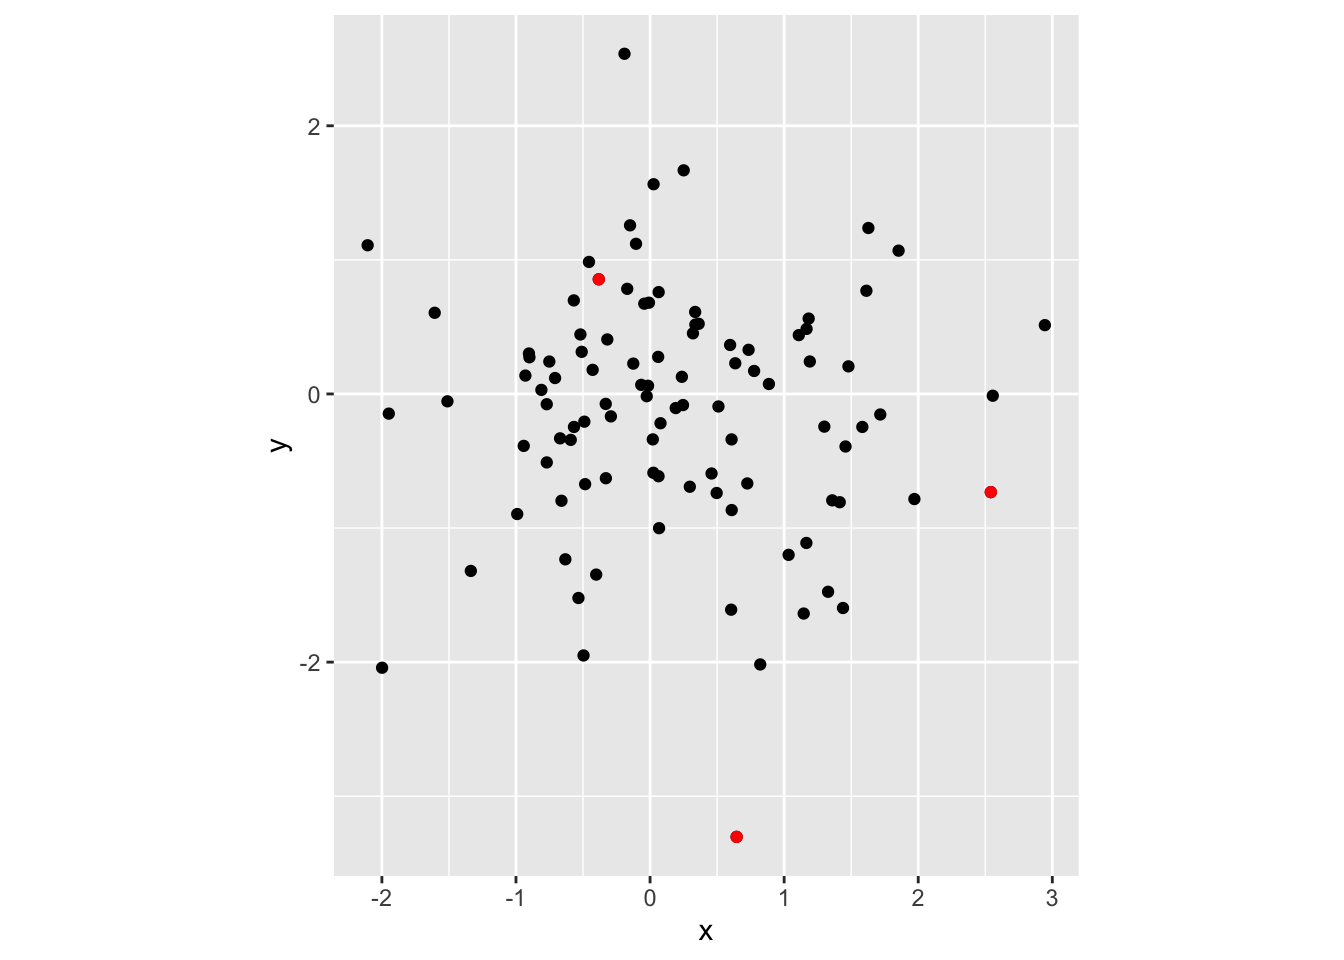
We can change the size by passing a value to size argument.
ggplot(df, aes(x=x, y=y)) +
  geom_point() +
  coord_equal() +
  geom_point(data=df2, aes(x=x, y=y),
             colour="red",
             size=5)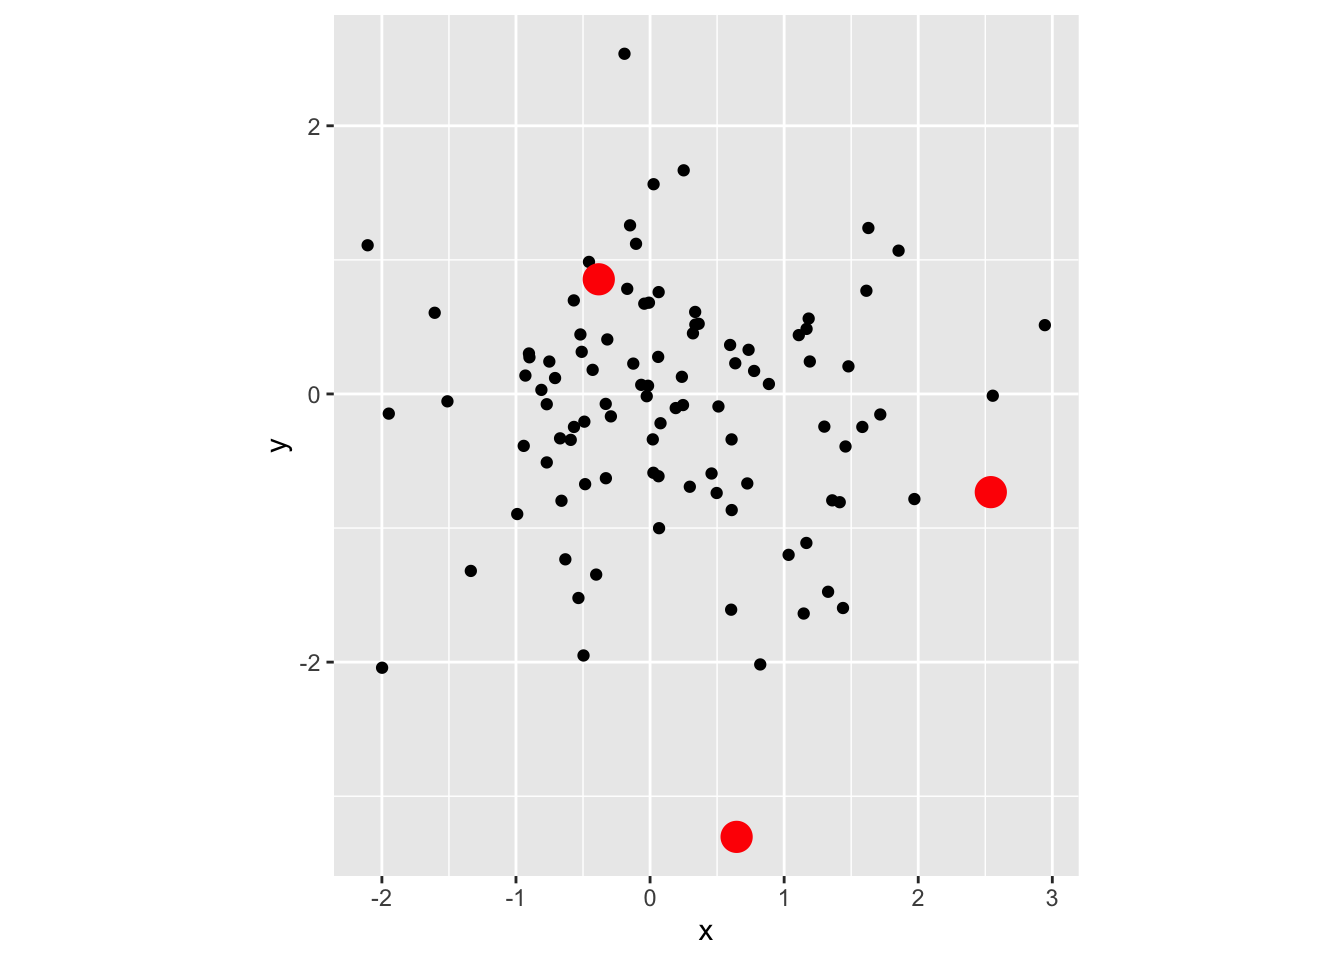
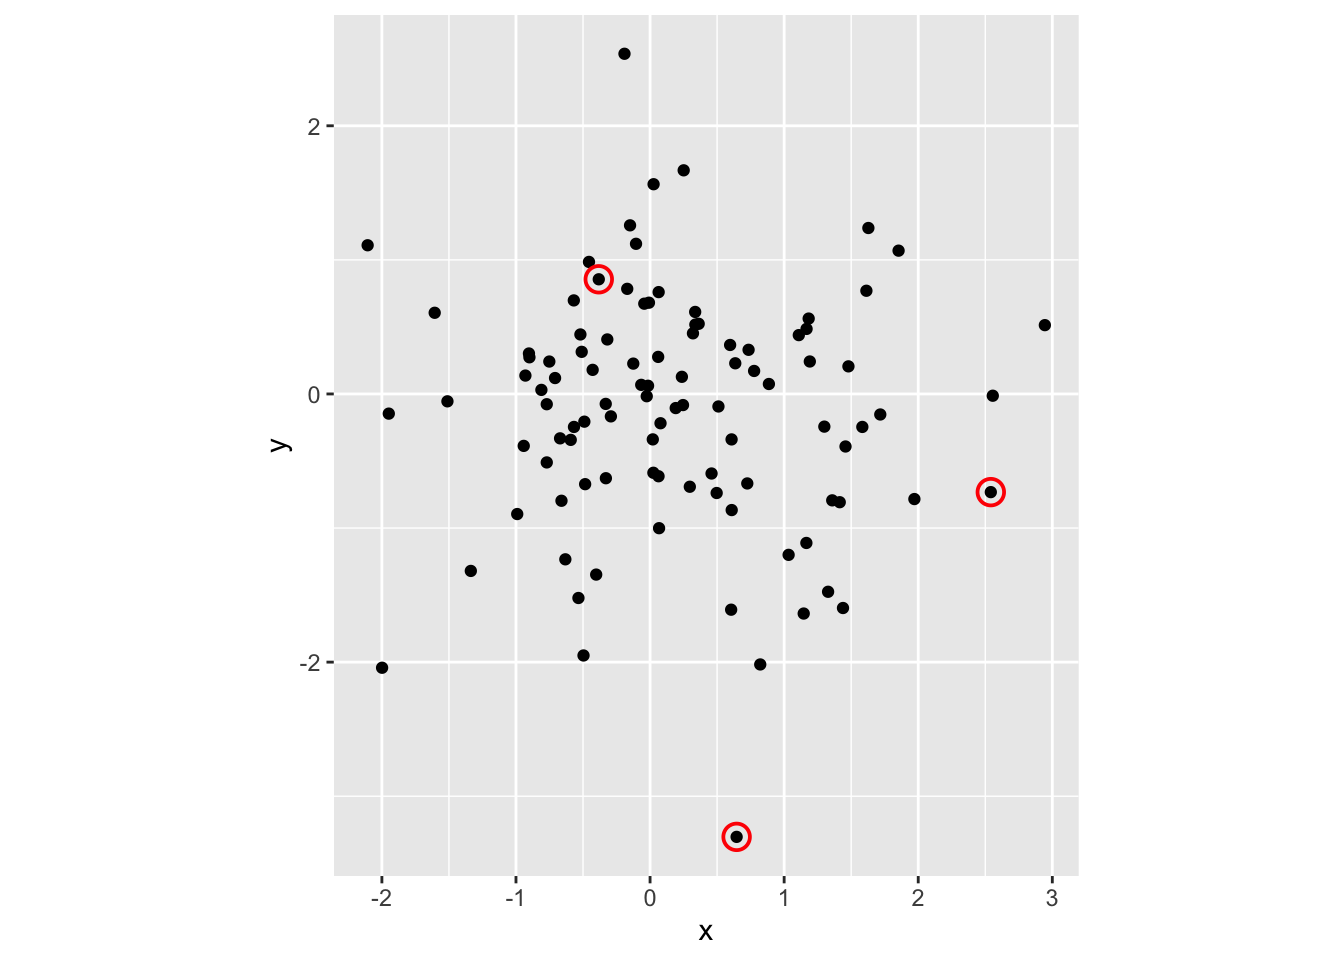
We can circle around the points by using the following command.
ggplot(df, aes(x=x, y=y)) +
  geom_point() +
  coord_equal() +
  geom_point(data=df2, aes(x=x, y=y), pch=21,
             fill=NA, size=4,
             colour="red", stroke=1)