Zoom Your Plots with ggforce
To enlarge a section of data in your ggplots, use the facet_zoom function in the ggforce package. To illustrate I am using the gapminder dataset in gapminder package.
Load necessary
library(tidyverse)
library(RColorBrewer)
library(ggforce)
library(gapminder)
Set the theme for plots
theme_set(theme_bw())Zoom according to a continuous scale variable
zoom the Y axis
ggplot(gapminder, aes(y=lifeExp, x=gdpPercap)) + geom_point() + coord_fixed() +
facet_zoom(ylim = c(60, 80)) 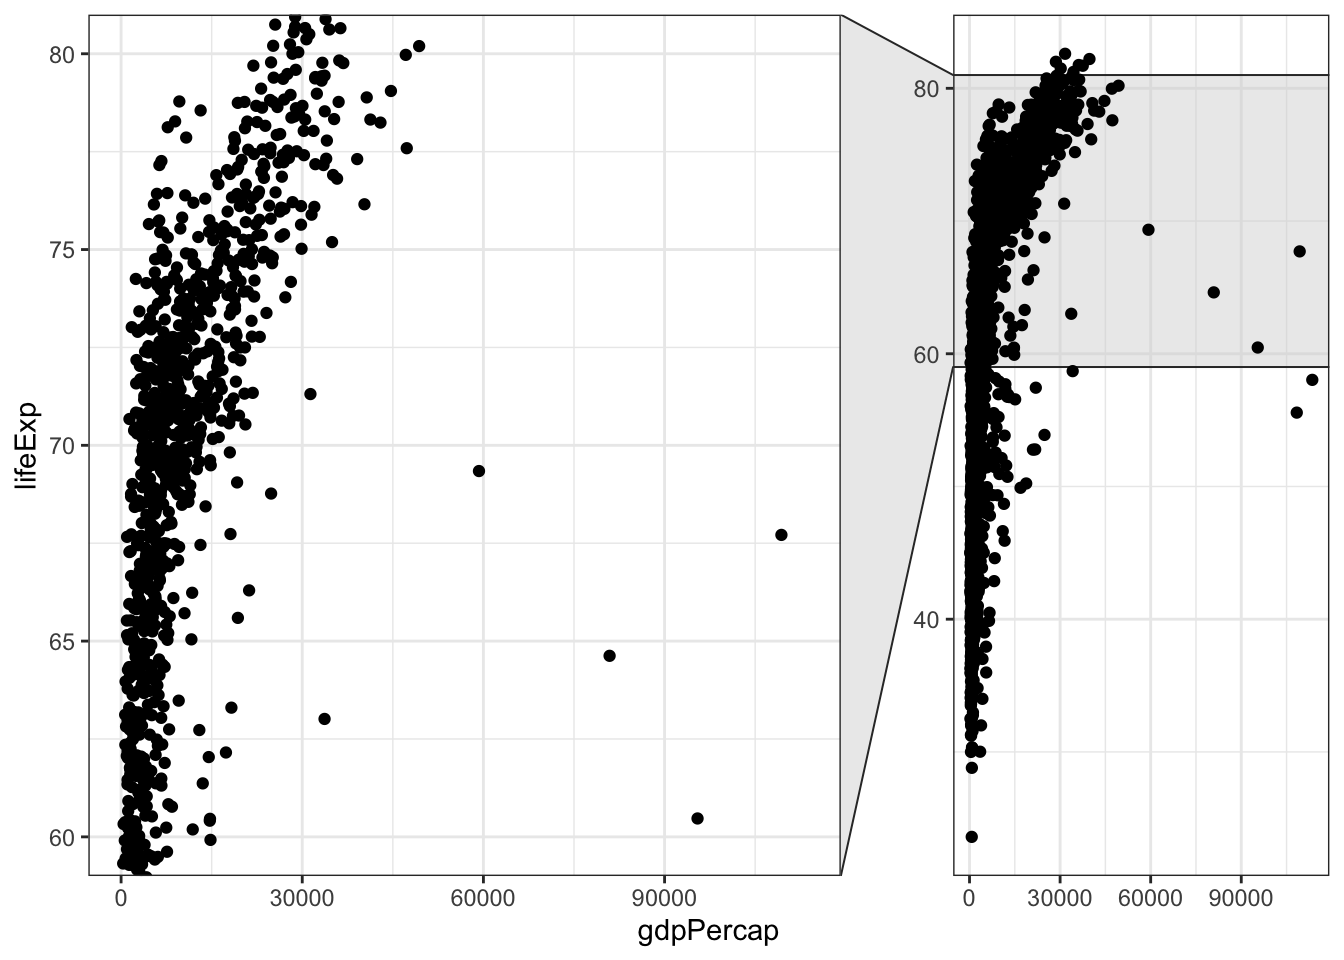
zoom the X axis
ggplot(gapminder, aes(y=lifeExp, x=gdpPercap)) + geom_point() + coord_fixed() +
facet_zoom(xlim = c(0, 10000)) 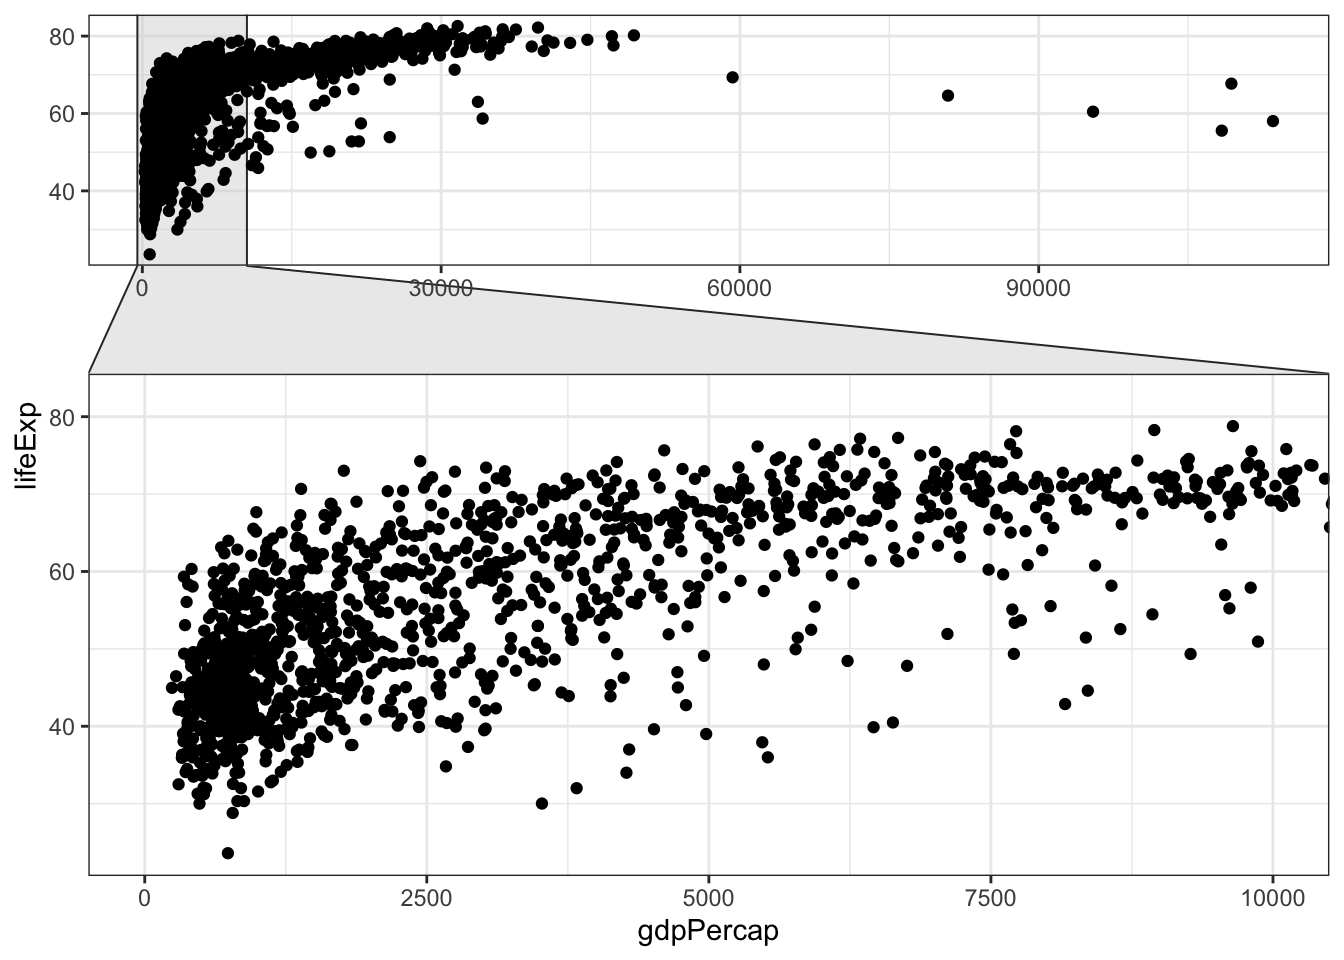
zoom the X axis and the Y axis
ggplot(gapminder, aes(y=lifeExp, x=gdpPercap)) + geom_point() + coord_fixed() +
facet_zoom(xlim = c(0, 10000), ylim=c(60, 80)) 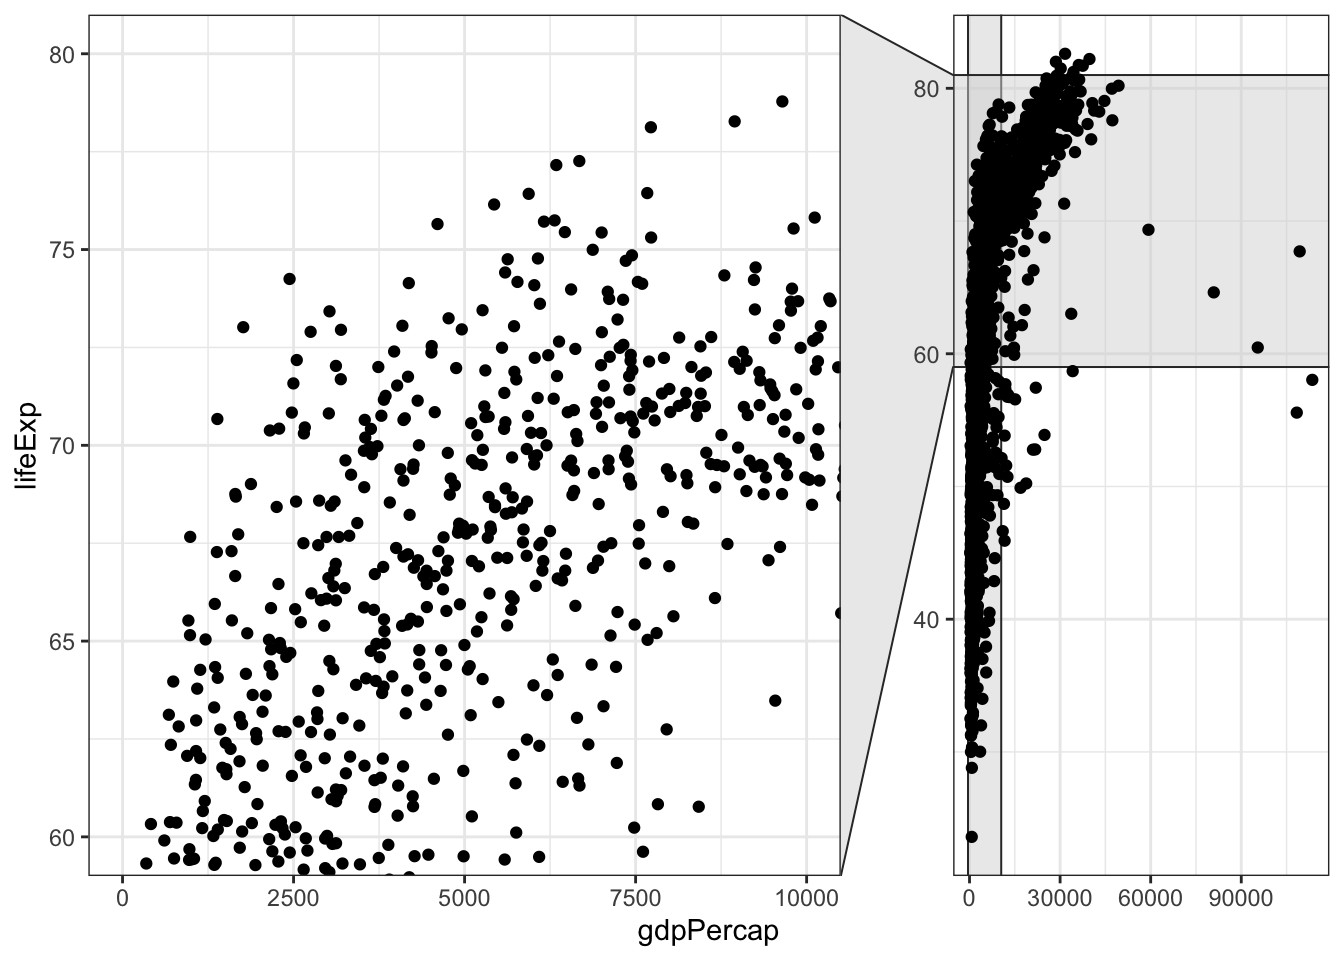
Zoom according to a qualitative variable
zoom the Y axis
ggplot(gapminder, aes(y=lifeExp, x=gdpPercap, col=continent)) + geom_point() +
  coord_fixed() +
  scale_color_brewer(palette = "Dark2") +
facet_zoom(y = continent == 'Oceania') 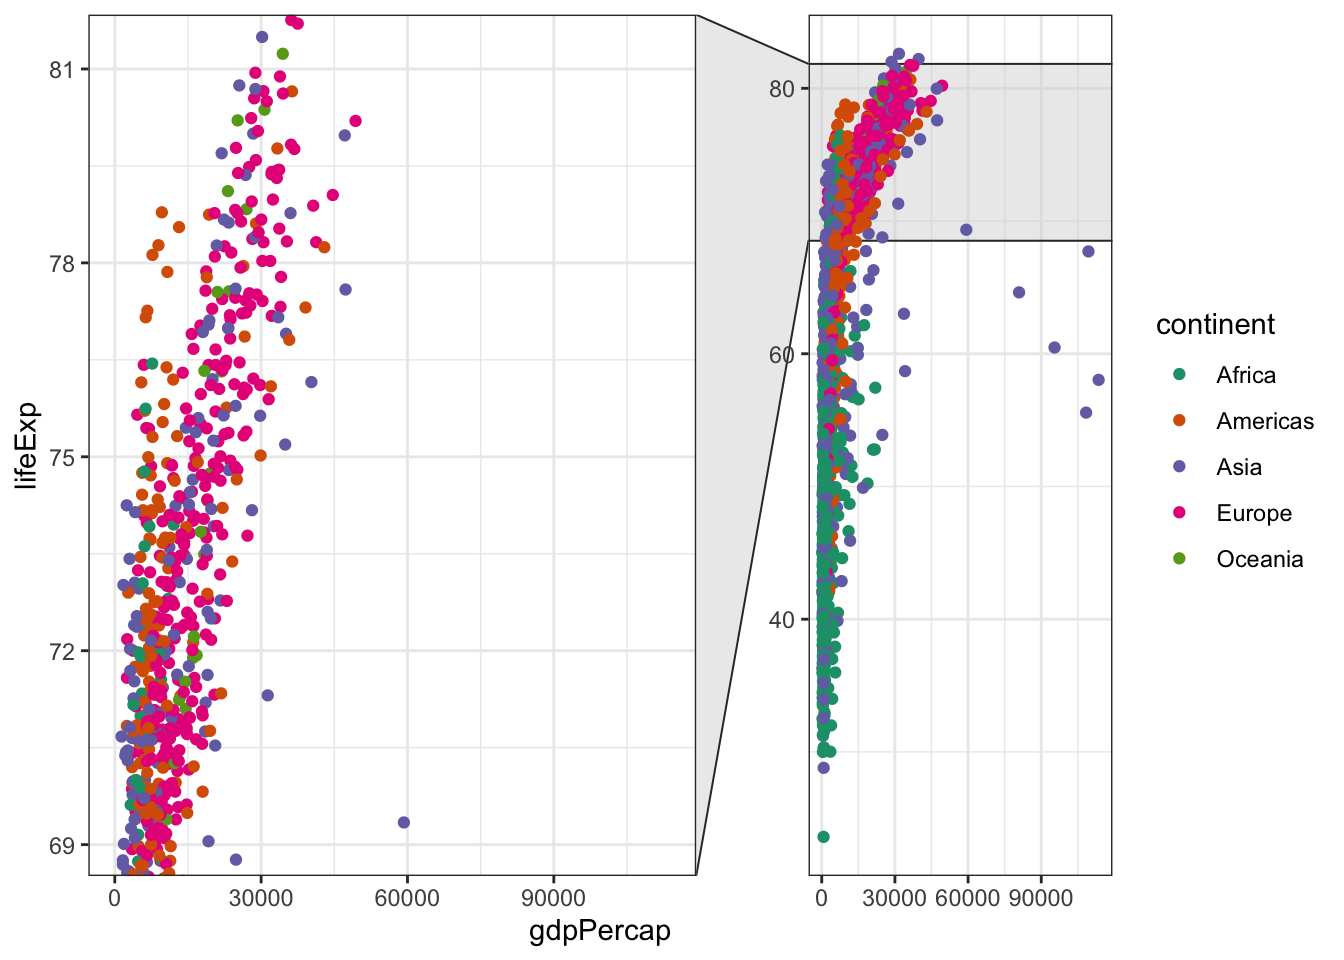
zoom the X axis
ggplot(gapminder, aes(y=lifeExp, x=gdpPercap, col=continent)) + geom_point() +
  coord_fixed() +
  scale_color_brewer(palette = "Dark2") +
facet_zoom(x = continent == 'Oceania') 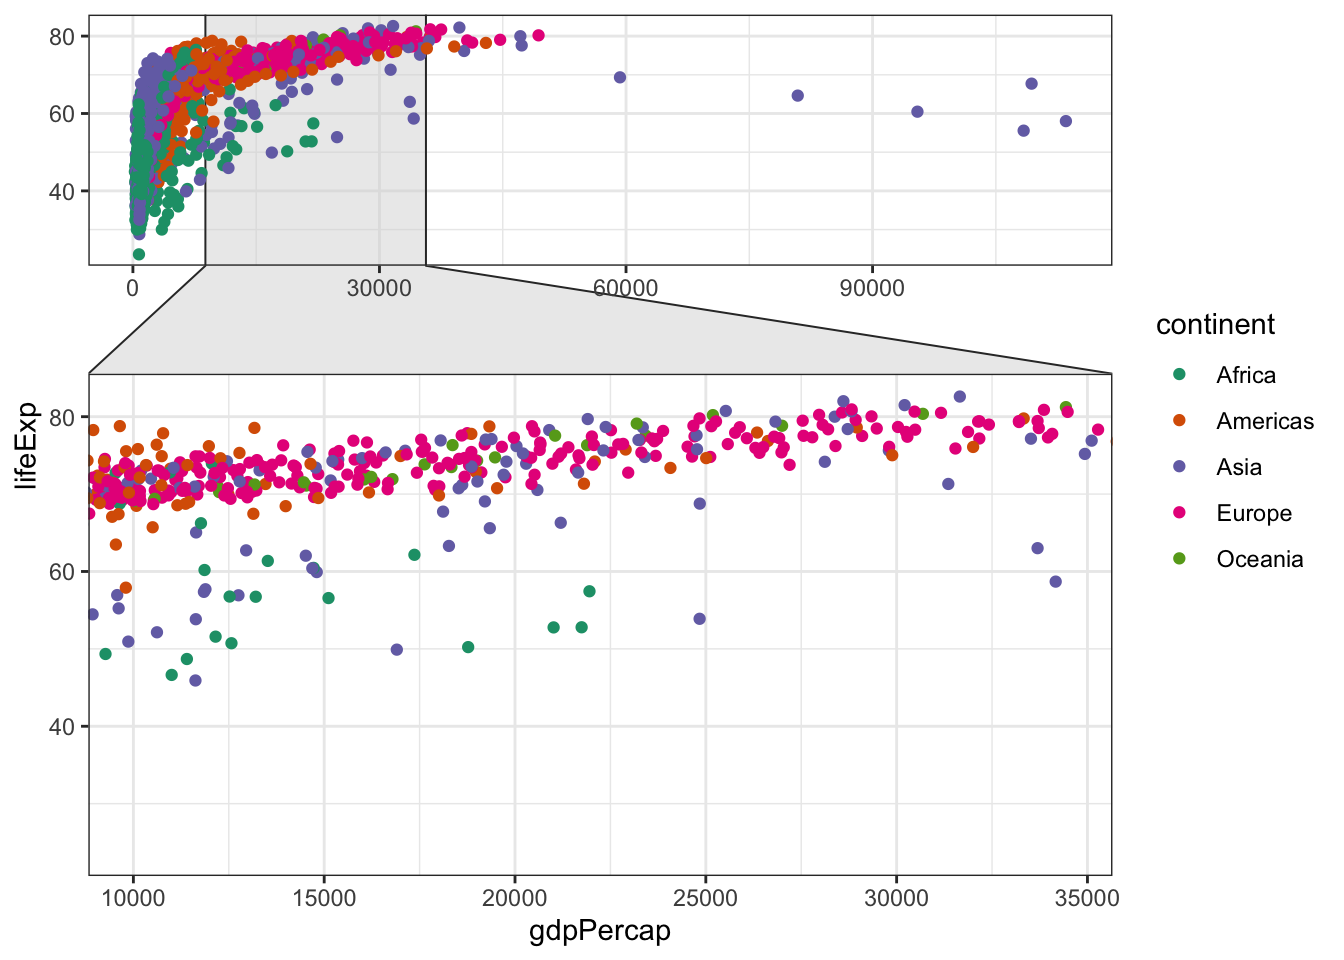
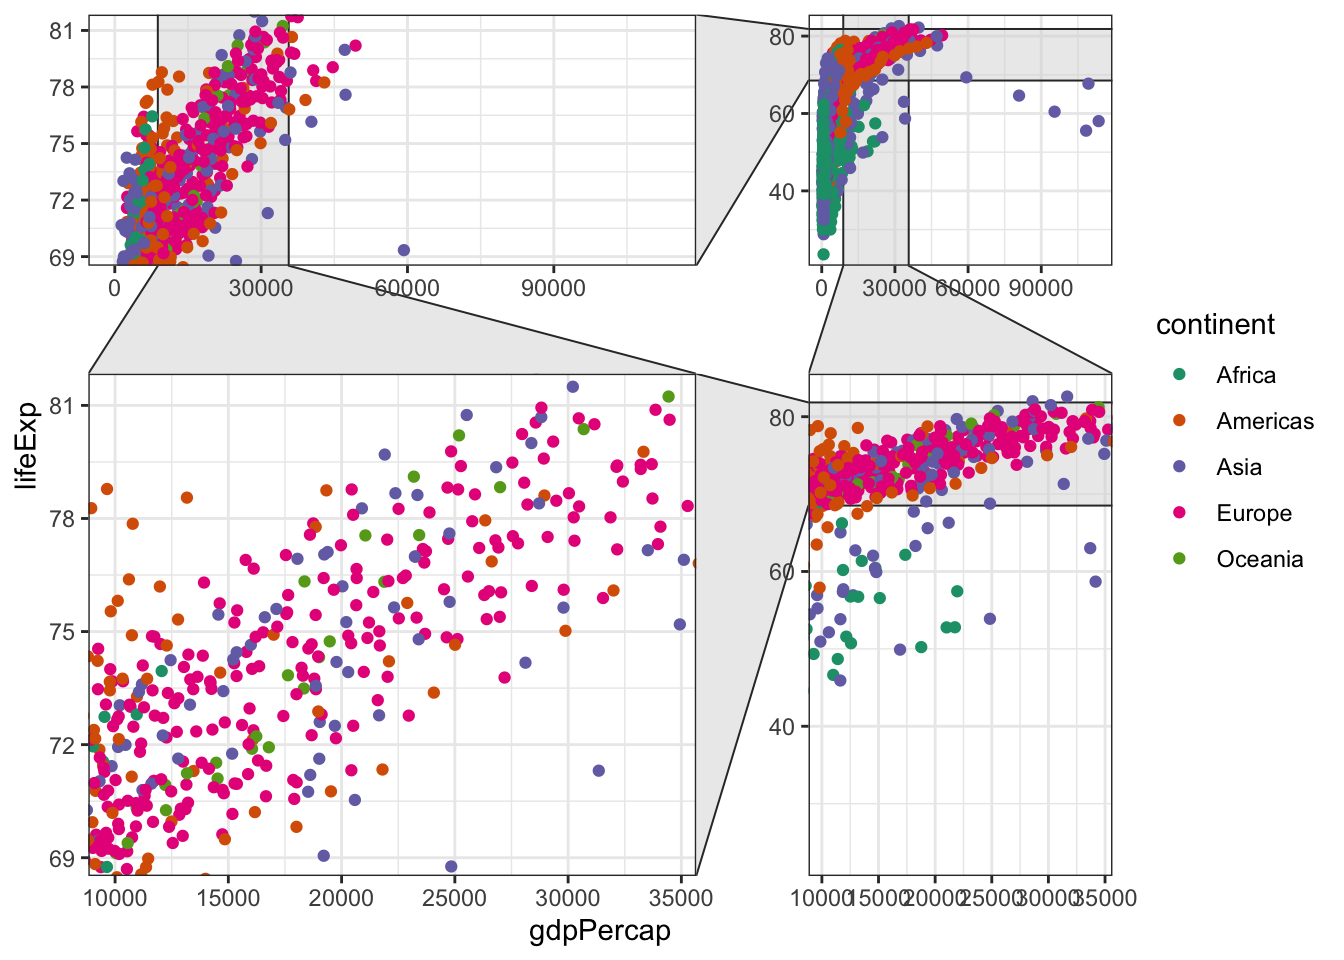
zoom the X axis and the Y axis
ggplot(gapminder, aes(y=lifeExp, x=gdpPercap, col=continent)) + geom_point() +
  coord_fixed() +
  scale_color_brewer(palette = "Dark2") +
facet_zoom(xy = continent == 'Oceania') 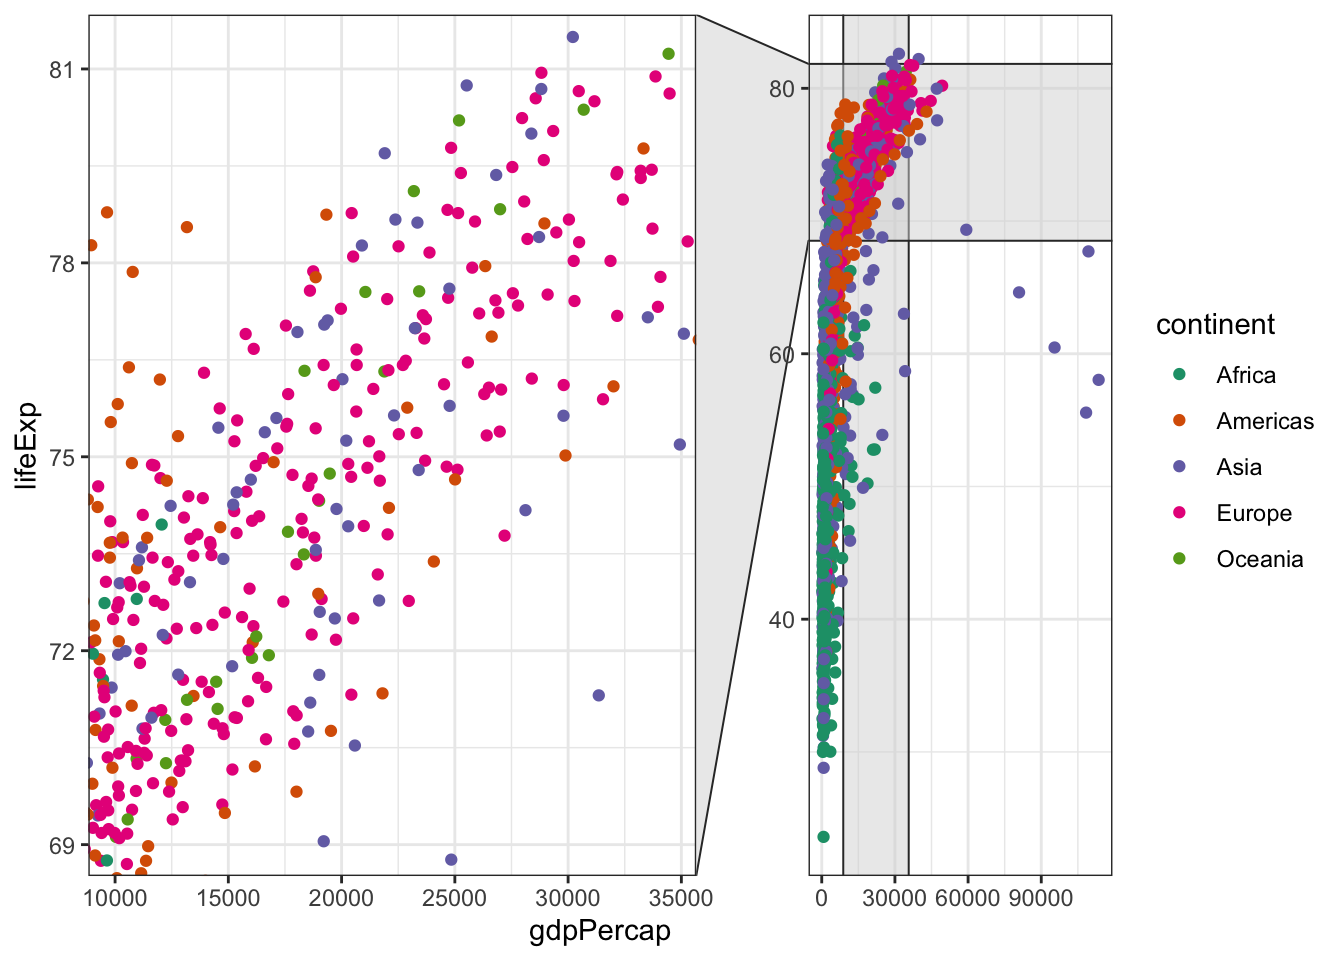
ggplot(gapminder, aes(y=lifeExp, x=gdpPercap, col=continent)) + geom_point() +
  coord_fixed() +
  scale_color_brewer(palette = "Dark2") +
  facet_zoom(xy = continent == 'Oceania', split = TRUE)